A comparison of Vietnam, China and US economic structure
The percentage of Vietnam’s exports to the United States against her total exports increased from 19.7% in 2010 to 23.2% in 2019, and to China from 10.7% in 2010 to 15.7% in 2019.
Meanwhile, the percentage of Vietnam’s imports from the United States against her total imports rose from 4.4% in 2010 to 5.7% in 2019 and from China from 23.8% in 2010 to 29.8% in 2019.
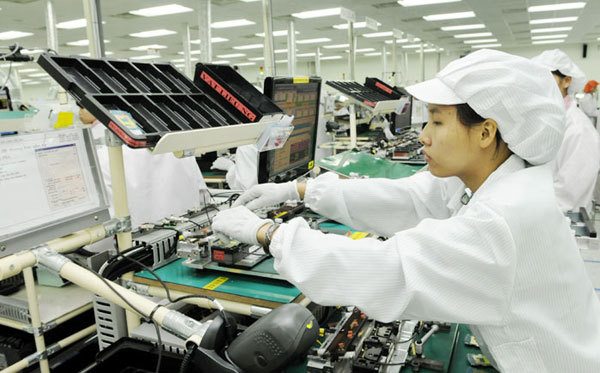 |
| The productivity of Vietnam in terms of the value added against the gross output is the lowest among the three countries, with 29%, while the productivity of China is 32.7% and the U.S. 55.8% – Photo: SGT |
In trade with the U.S., Vietnam always enjoys a surplus, which increased 4.5 fold in 2010-2019.
In trade with China and South Korea, the country always suffers a deficit. The trade deficit with China increased 2.7 fold in 2010-2019 and with South Korea 4.1 fold in 2010-2019.
In the period 2010-2019, the GDP growth in average 2010 prices of China was 7.7%, the U.S. 2.3% and Vietnam 6.3%. However, in terms of scale, in 2019, the GDP of China reached US$11,537 billion, 57 times as much as Vietnam’s GDP; the GDP of the U.S. reached US$18,273 billion, 91 times as much as Vietnam’s GDP which was a modest US$201 billion at that time.
An analysis of the input-output table shows the following results:
• The gross value added (GVA) against the gross output (GO) of Vietnam is 28%, China 32.7% and the U.S. 55.8%. This figure shows that the added value in production of Vietnam is very low, and the economy is basically sub-contracting.
• The percentage of value added in the gross value added of agriculture, forestry and fisheries (sector 1) of Vietnam is 15.9%, of construction and industry (sector 2) 47.5% and of services (sector 3) 36.6%. The respective percentages of China are 9.2%, 40.7% and 50.1%. The respective percentages of the U.S. are 1.1%, 21.1% and 77.8%.
• The percentage of value added against the gross output in sector 1 of Vietnam is 33.9%, sector 2 21.7% and sector 3 46.3%. The respective percentages of China are 58.8%, 20.8% and 53.1%. The respective percentages of the U.S. are 37.5%, 42.9% and 61.3%.
Some remarks can be withdrawn from these figures.
First, the economic structures of China and the U.S. have shifted markedly towards increasing industry and services and decreasing agriculture, especially the U.S., with the percentage of agriculture in the economy in 2018 being only 1.1%.
Second, the productivity of Vietnam in terms of the value added against the gross output is the lowest among the three countries, with 29%, while the productivity of China is 32.7% and the U.S. 55.8%.
A general comparison of the economic structure based on the input-output tables of Vietnam, China and the U.S. shows the following points:
The percentage of the intermediary cost versus the production value in Vietnam is the highest, followed by China and then the U.S. This percentage partly shows the productivity. In the U.S., every US$100 produced creates US$57 in added value; in China the added value is US$33 and in Vietnam US$28.
The Business White Book 2020 shows that the intermediary cost against the gross revenue of private enterprises is 91%, meaning that of US$100 in the production value, only US$9 is the added value. The percentage of State enterprises is 88% and foreign direct investment (FDI) enterprises 75%. That said, the proprietorship sector is the sector that creates US$28 in added value out of US$100 in production value (the added value of the sector makes up 30% of the GDP). This fact shows that the economy of China and Vietnam is a sub-contracting economy. For Vietnam, it is both a sub-contracting (for the corporate sector) and piecemeal, fragmented economy.
• In terms of the elasticity of labor and capital, Vietnam needs much capital to create growth, then come China and the U.S. A surprise is that despite an unbalanced structure of labor and capital, the investment against GDP in Vietnam fell from 46% in 2007 to 28% in 2019 while the GDP growth was still high. This can only be interpreted that either the productivity in Vietnam has increased strongly or the salary has risen spontaneously with no correspondence to productivity. Statistics show that the productivity in Vietnam is essentially created by sectors which are monopolistic or heavily dominated by “relationship” such as mining, electricity and real estate. Still, Vietnam’s productivity is lower than Laos (with current figures).
• In terms of factors of final demand, the final consumption of the population against the GDP of Vietnam and the U.S. is the same (68%), while the ratio of China is only 39%. That said, to boost growth, China must have huge investments, equivalent to as much as 45% of the GDP.
A deeper look into the ripple effect of factors of final demand on the production value and the added value show that exports of the U.S. do not have a ripple effect on the production value as strong as that of China but have a very strong effect on the added value. Most factors of final demand such as final consumption (in urban and rural areas), investment and exports of the U.S. have stronger effect on the added value than those of China and Vietnam.
The effect of factors of final demand on the production value and the added value of Vietnam is lower than those of China and the U.S. Among the factors of final demand of Vietnam, exports have the lowest effect on the added value. The factor which has the strongest effect on the added value of Vietnam is final consumption in rural areas. Therefore, with the economic structure and the ripple effects described, Vietnam could not advance if the country does not really change but only looks at GDP growth.
For China, though final consumption has quite a good effect on the added value, the final consumption over the past 10 years has not increased to 50% equivalent to the GDP. So, though China has made many strong statements and some studies have forecast that China will surpass the U.S. by 2030 based on the GDP targets the country has announced, they are all propagandist rather than realistic.
Conclusion
A comparison of the economic structures of Vietnam, China and the U.S. shows that the economic structure of the U.S. is the most healthy and effective. The increase in aggregate demand really boosts the supply side such as the production value and income.
The economic structure of Vietnam shows that exports (of the FDI sector and the domestic sector) do not really have much significance to the population and the economy.
GDP is a temporary criterion for relative comparison between countries, but it does not really have much economic significance to countries which are essentially sub-contracting economies.
Source: Vietnamnet Global