How I Use Earned Value Management (EVM) to Track Agile Scrum Projects
Earned Value Management (EVM) is a technique that can be used on project to monitor the performance and progress of projects. It is typically associated with traditional project management. According to PMP Project Management Professional Exam Study Guide, Earned Value Management “compares what you’ve received or produced to what you’ve spent… EVM looks at schedule, cost, and scope project managements together and compares them to the actual work completed to date.”
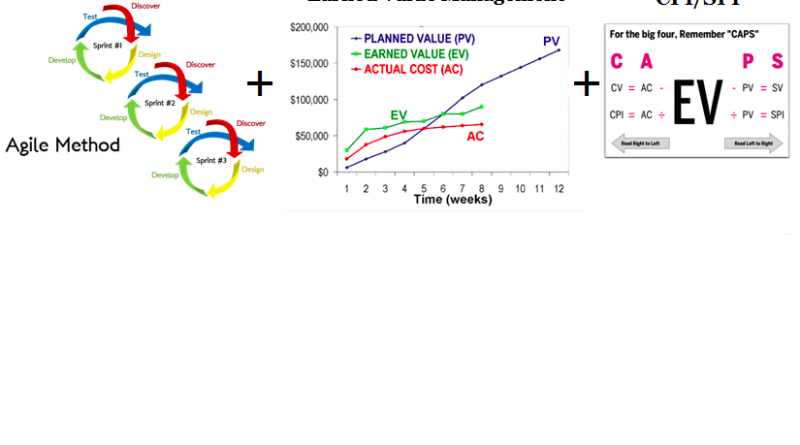
If you have read one of my previous blog posts, Waterfall, Agile & the “Triple Constraint”, you know that the three constraints on a project are functionality (scope), cost (time spent) and schedule (days spent). If you have also read my other blog post, Time Remaining is More Important Than Time Spent, you know why it is important to focus on time remaining instead of time spent. So with these 4 pieces of data, it is easy to create a chart that plots these elements into a single view (see below).

It is easy to understand that in an ideal world, we would work at an ideal pace that allows us to progress at an equal rate in each of these areas. This means that when we complete 25% of the functionality, we would have spent 25% of the hours (meaning we have 75% remaining – right on track) and have consumed 25% of the schedule.
In the above example, the project is using story points to measure functionality. They have delivered 25% of functionality (25/100 points), spent 25% of their time (250/1,000 hours), have 75% remaining (750/1,000 hours) and have consumed 25% of their schedule (25/100 days). All elements line up on the graph and we can see this project is healthy and assuming their continued at this pace would most likely deliver all of the functionality, on budget and schedule.

Now let’s look at an example of another project. It is easy to see at a quick glance that all of the elements no longer line up. The team has delivered 13% of functionality (13/100 points), spent 50% of their time (500/1,000 hours) and consumed 33% (33/100 days) of their schedule. As mentioned in Time Remaining is More Important Than Time Spent, it would be incorrect to assume that because the team estimated the project at 1,000 hours and has consumed 500 hours that they have 500 hours remaining. That would be true if they delivered 50% of functionality, but in this case they have only delivered 13%.
Now I know the agile purists may balk at converting hours to points, but this approach uses historical data to provide a projection into what the future will look like. Some simple calculations will show about how many hours each point takes to deliver and can use that information to project the total number of hours that it will take to deliver all of the points.
500 hours completed /13 points delivered = ~38.5 hours per point delivered
87 points remaining * ~38.5 hours per point = 3349.5 hours
So where this project initially estimated that it would take 1,000 hours to deliver all 100 points, actual data from their progress thus far is showing that it will more than likely take much more time (3,850 hours). Additionally, we have spent 50% of our time (and have 87% of it remaining) and 33% of our schedule to deliver 13% of our functionality.
33 days / 13 points = ~2.5 days per point
~2.5 days * 87 points remaining = 217.5 days
So we can see that where we initially expected the project to take 100 days, it now looks like it will take ~250 days to deliver all functionality.
The reason I love this graph so much is that is is simple, only uses a few key data points and not only provides an accurate representation of current project status, but also the ability to project out the remainder of the project. You can imagine that there are several other calculations and projections that you could make (depending on your needs), such as how many points would be completed by the end of 100 days.
33 days / 13 points = ~2.5 days per point
67 remaining days / 2.5 days per point = ~27 points
13 completed points + 27 projected points = 40 total points
You should also see how easy it would be to enter these calculations into a spreadsheet and have a lightweight project tracking device.